Bollinger Bands and Volatility Envelopes
Measure price dispersion and identify explosive momentum breakouts using dynamic volatility channels.
play_circle Mastering Bollinger Bands with SMB Capital
Strategic Briefing: Learn how professional proprietary traders use Bollinger Bands to identify high-probability mean reversion and breakout opportunities.
Understanding Volatility Bands
Developed by John Bollinger, these bands consist of a simple moving average (usually 20-period) and two standard deviation bands plotted above and below it. They dynamically expand during periods of high volatility and contract during periods of low volatility.

The Bollinger Squeeze
When the bands tightly constrict together (a "Squeeze"), it indicates a period of abnormally low volatility. In financial markets, low volatility mathematically guarantees incoming high volatility. Traders use the squeeze to anticipate violent, directional breakouts.
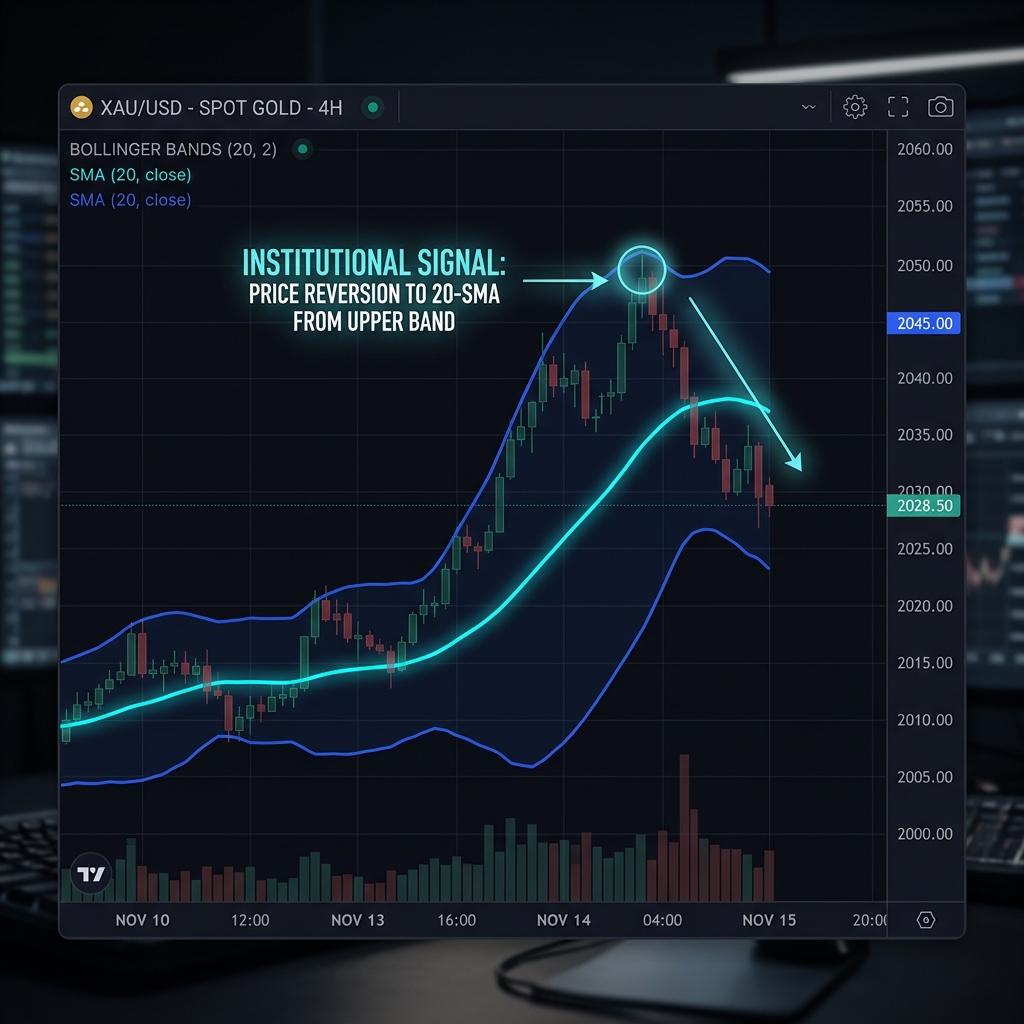
Mean Reversion and Riding the Band
While price touching the upper band often signals an overbought condition (prompting a mean-reverting short), in strong trends, price can "ride the band" for extended periods. Combining Bollinger Bands with the RSI helps differentiate between a valid mean-reversion setup and a massive parabolic breakout.
Ready to apply this strategy?
Access real-time, deterministic signals and institutional liquidity tracking directly in the AlphaSignal terminal.
LAUNCH TERMINAL