Candlestick Patterns
Learn the foundational visual language of price action. Master how to interpret bullish engulfing, dojis, and hammer candles to predict immediate momentum shifts.
play_circle Institutional Candlestick Analysis Masterclass
Strategic Briefing: Learn how to read price action through candlesticks with an institutional perspective on supply and demand.
The Language of Price
Candlestick charts provide a visual representation of price action over a specific timeframe, summarizing the open, high, low, and close (OHLC). This is essential for quickly interpreting market sentiment.
Key Reversal Patterns
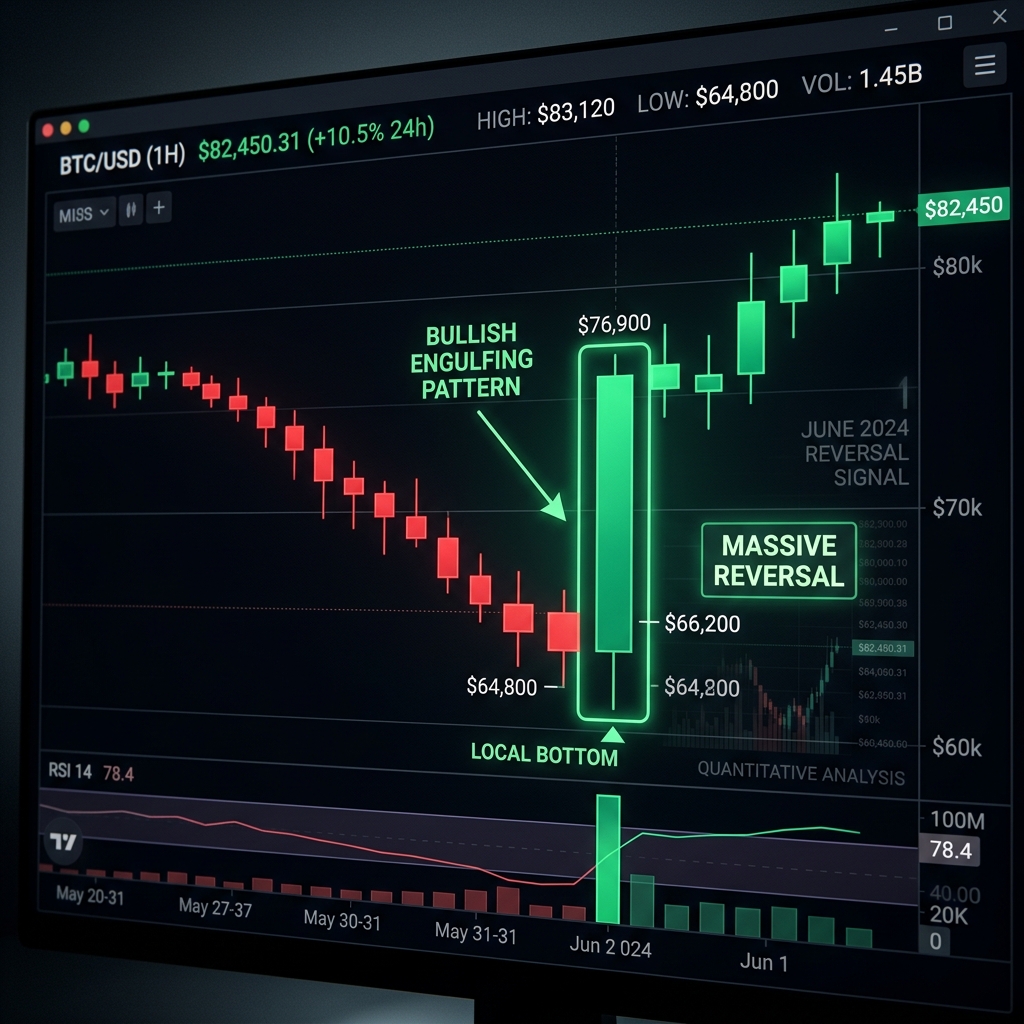
- Bullish Engulfing: A large green candle completely engulfing the previous red candle's body, indicating a strong influx of buying pressure.
- Hammer: A small body with a long lower wick, suggesting that sellers pushed the price down, but buyers overwhelmed them to close near the open. Often marks a local bottom.
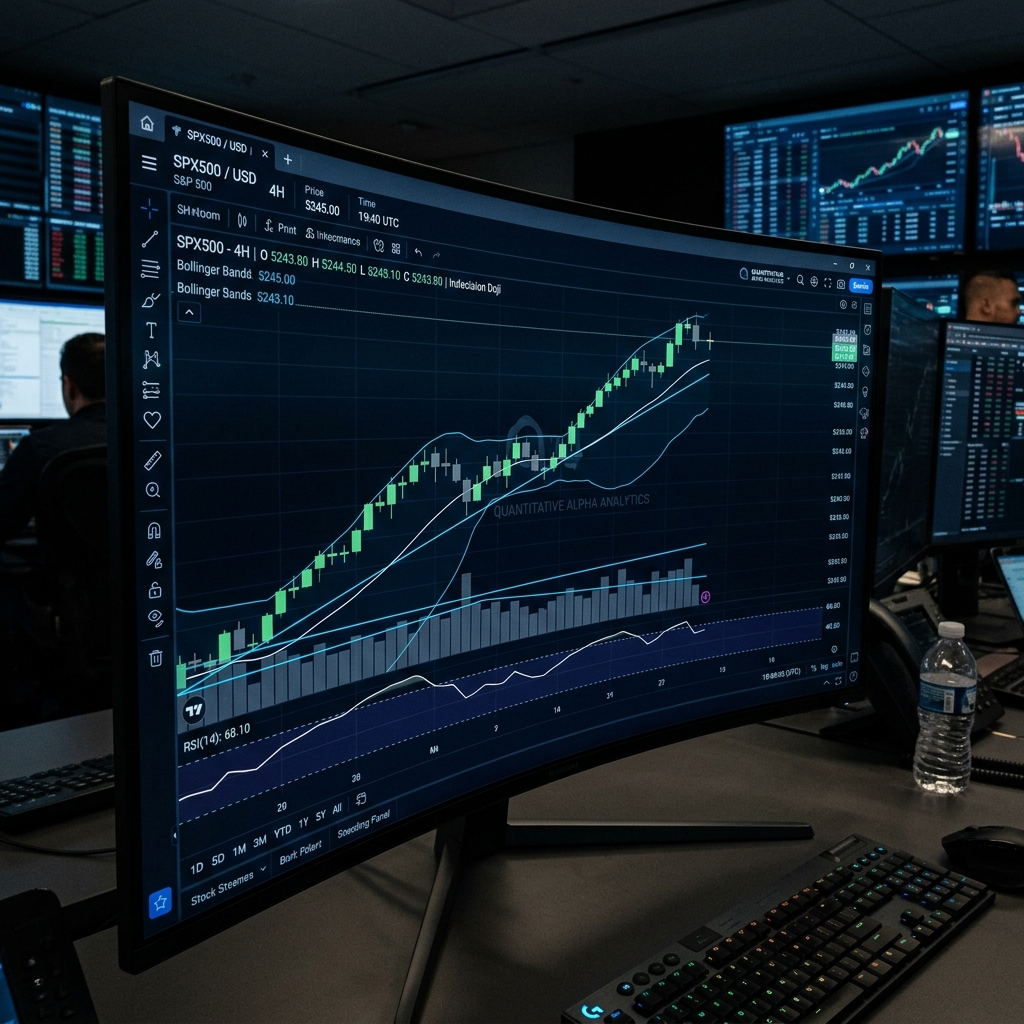
Continuation vs. Indecision
A Doji, characterized by a very small body and long wicks on both sides, indicates market indecision. The battle between buyers and sellers is tied. When a Doji forms after a prolonged trend, it often acts as an early warning of an impending reversal or significant consolidation.
Ready to apply this strategy?
Access real-time, deterministic signals and institutional liquidity tracking directly in the AlphaSignal terminal.
LAUNCH TERMINAL