Fibonacci Retracements in Cryptocurrency
Apply the golden ratio to financial markets. Learn how to use Fibonacci retracement levels to identify invisible support and resistance zones during explosive market trends.
play_circle Institutional Fibonacci Masterclass

Strategic Briefing: Learn how professional traders use Fibonacci levels to identify high-probability institutional entry zones.
The Golden Ratio in Markets
Derived from the mathematical sequence discovered by Leonardo Fibonacci, the Fibonacci retracement tool is a staple in institutional technical analysis. It operates on the premise that markets do not move in straight lines; after a strong impulsive wave, price will naturally retrace a predictable percentage of that move before resuming its trend.
Key Retracement Levels
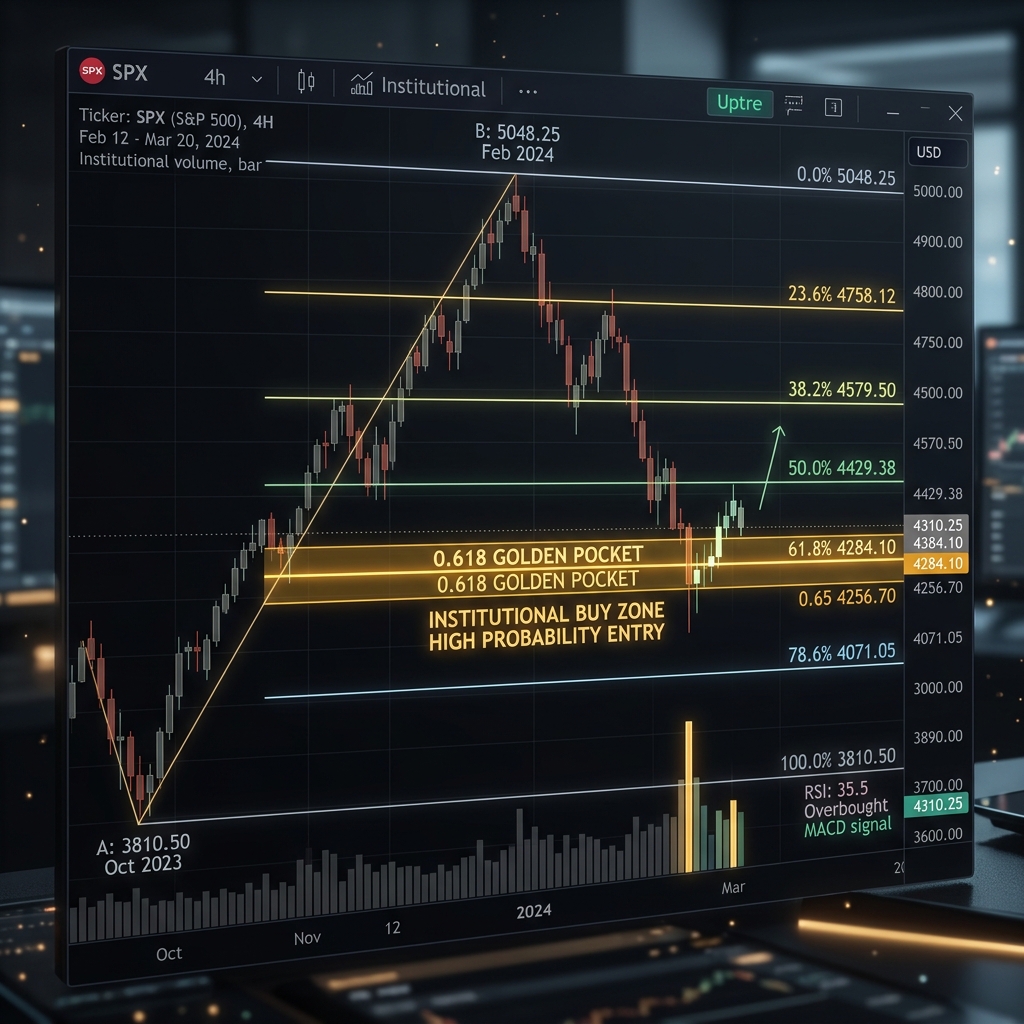
Traders draw the tool from a major swing low to a major swing high. The tool plots horizontal lines at key psychological percentages:
- 0.382 (38.2%): A shallow retracement indicating extremely strong underlying momentum.
- 0.500 (50.0%): While not an official Fibonacci number, the 50% mean reversion is a classic institutional algorithmic entry point.
- 0.618 (61.8%): Known as the "Golden Pocket," this is mathematically the most profound and reliable zone for placing limit orders to buy the dip.
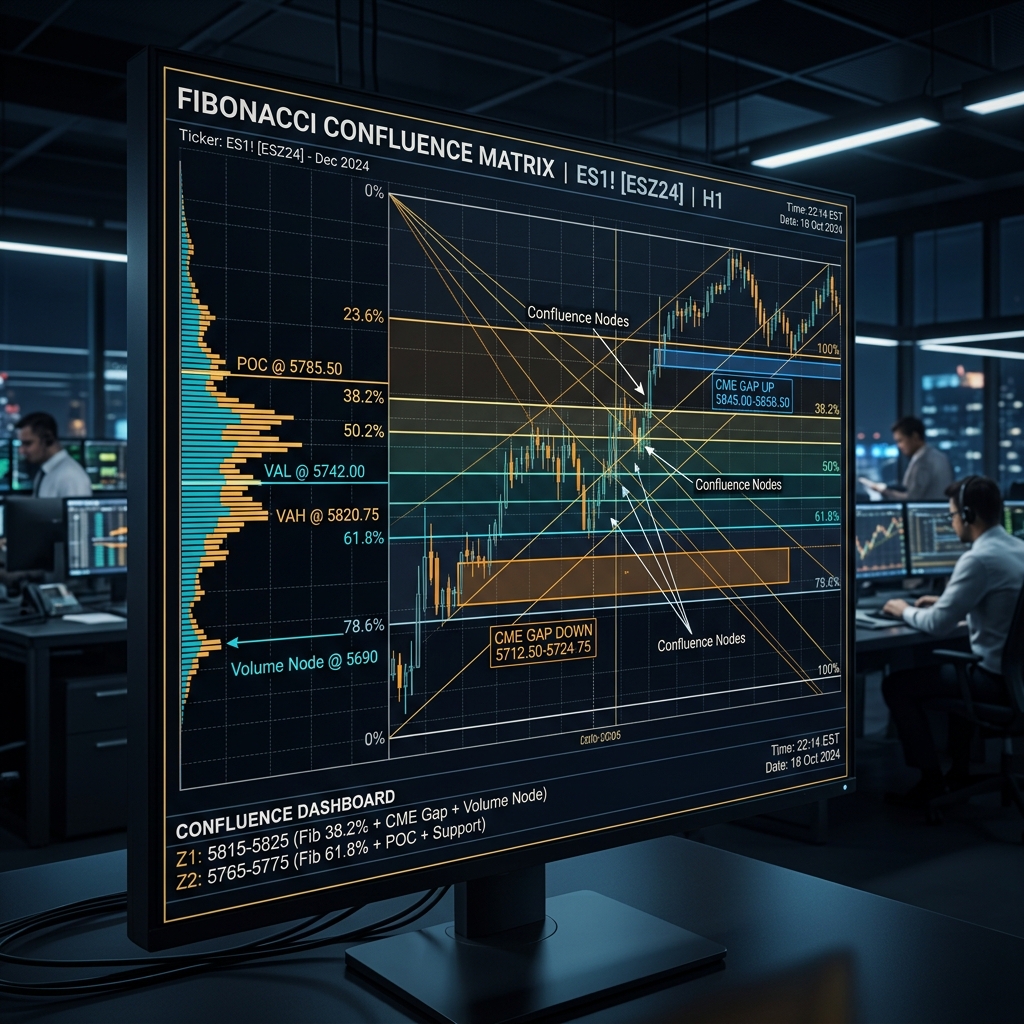
Confluence is Key
Trading a Fibonacci level in isolation is risky. These mathematical lines become robust trading frameworks only when they exhibit Confluence. If the 0.618 Golden Pocket perfectly aligns with a historical Support level, an unfilled CME Gap, and an AlphaSignal Z-Score of -2.5, you have identified a phenomenally high-probability entry vector.
Ready to apply this strategy?
Access real-time, deterministic signals and institutional liquidity tracking directly in the AlphaSignal terminal.
LAUNCH TERMINAL